Viewing the observation
Note that not all the data is available for observations early in the Chandra mission, and I have not yet worked out how to tell the difference, so some links may be broken on those pages. Also, there was briefly a "view" that showed the Chandra data from the observation (if it was released to the public), but it was causing too much of a problem for the Chandra Data Archive so I have temporarily removed it until we can come up with a better solution.
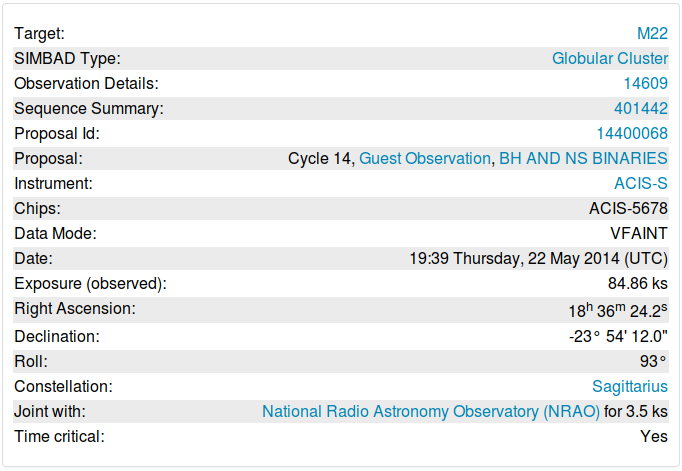
For science observations, there are a selection of "views" provided. In the following we use two observations - 14609 (ACIS-S of M22) and 16294 (ACIS-I of M31) - as our primary examples; M22 is a Globular Cluster and M31 is also known as the Andromeda Galaxy. The following sections explain the various views: Optical, X-ray (RASS), X-ray (PSPC), Details, and Interactive.
- Optical
-
This shows the STScI Digitized Sky Survey (DSS) image of the sky surrounding the target. These images are scans of observations of the night sky made with small (for modern standard) telescopes using photographic plates; they therefore represent a good representation of the night sky you would see if your eyes were extremely sensitive. Please see the Wikipedia article on Digitized Sky Surveys for more information.
Here we show the DSS images for the two observations.
On the left we have the observation details for M22: the aim point of the telescope is shown by the red cross and the six squares labelled 0 to 5 show the locations of the ACIS-S chips during the observation (the orientation is determined by the choice of aim point and the roll angle of the spacecraft during the observation). The four chips in a two-by-two arrangement to the left of the ACIS-S array shows the location of the ACIS-I array chips during the observation. The choice of chips that are turned on during an observation is made by the observer: for this observation they are the central four ACIS-S chips (labelled as 1 to 4 in red), although the outer two (labelled with green numerals) are optional and may be turned off if observational constraints require it.
On the right we have M31: in this case the aim point is on the ACIS-I array and two of the ACIS-S array chips (ACIS-S2 and ACIS-S3) may also be turned on.
Also labelled are the stars used to keep track of the telescope pointing during an observation (the Guide Stars) and those stars used after the telescope slew to ensure that the field has been correctly identified (the acquisition stars).
Additional labels and rectangles may be drawn for more complicated observations, such as those using only a fraction of a chip - the "sub-array mode" - in order to observer very bright sources.
The labels YOFF, ZOFF, ZSIM, and ACIS PB indicate parameter values used in the observation, such as the location of the instrument bench which holds the ACIS and HRC detectors.
- X-ray (RASS)
-
This shows the ROSAT All Sky Survey data available for the area. This survey was made by the ROSAT satellite - a German-led mission - which covered virtually all the sky using an X-ray imaging detector. This detector was only sensitive to "soft" X-rays - roughly 0.1 to 2.5 keV - and had a significantly larger PSF than Chandra.
The RASS view shows the same outline as the DSS image, but does not include the location of the stars used for acquisition and monitoring (they are generally not strong X-ray emitters). It is not uncommon to be unable to make out an X-ray source in the RASS data at the aim point of the Chandra observation, as it is in the M22 case. M31 is a bright X-ray source and so is seen in the RASS.
- X-ray (PSPC)
-
This view shows the ROSAT PSPC data available for the area, taken from the "pointed phase" of the Observatory's lifetime. Since this did not cover the whole sky, regions may contain no data, or the data only partly covers the image. if present, the data is generally of "higher quality" than the All-Sky-Survey data since the observation times are generally significantly longer than, and the PSF size is slightly smaller than, the RASS.
In this case there were two PSPC observations of the M22 field, one centered on M22 and one which just overlapped it to the right. Both observations were significantly longer than the RASS observation - shown by the larger number of counts in the background and the fact that some sources can just be seen near M22 that are not obvious in the RASS data. As with Chandra, PSPC observations have a spatially-varying PSF; as you move further from the center of the observation, the PSF increases (this does not happen for the RASS observations due to the way those observations were taken). This can be seen by viewing the source seen in both the RASS and PSPC images; it is far off axis in the PSPC case which means its PSF is larger, and shows more structure, than if it were on axis.
The area around M31 was covered by many PSPC observations, and you can make out the emission from the halo of the galaxy as well as some of the point sources; these are mostly X-ray binaries in the galaxy, but some may be background Active Galactic Nuclei (AGN).
- Details
-
A list of the observation details is displayed; this includes more information than provided by default, and is considered an "expert" view.
- Interactive
-
The Browse page provides a much-more informative display via the WWT interface, and is to be preferred to this "Interactive" view.
The WWT view shows the approximate field of view of the observation using the WebGL version of the American Astronomical Society's WorldWide Telescope - aka WWT - web client. Note that this interface only provides a small subset of the features of the full WWT web client.
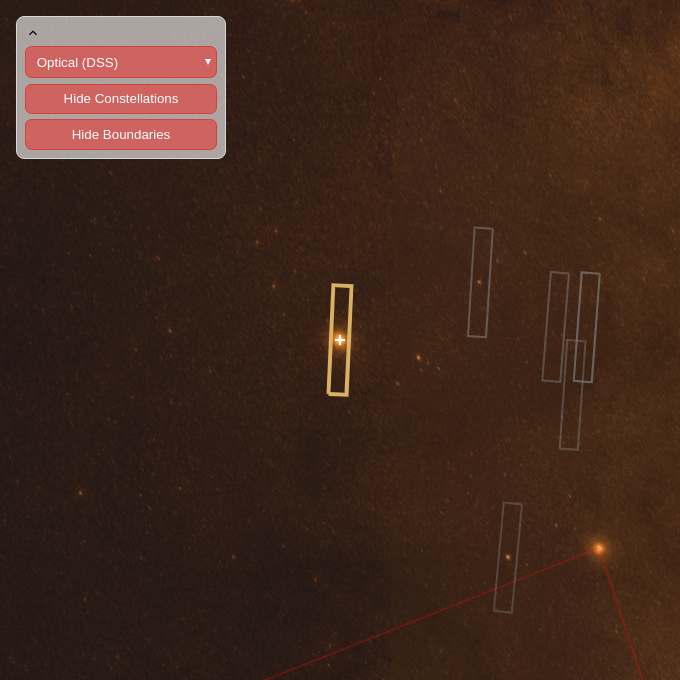
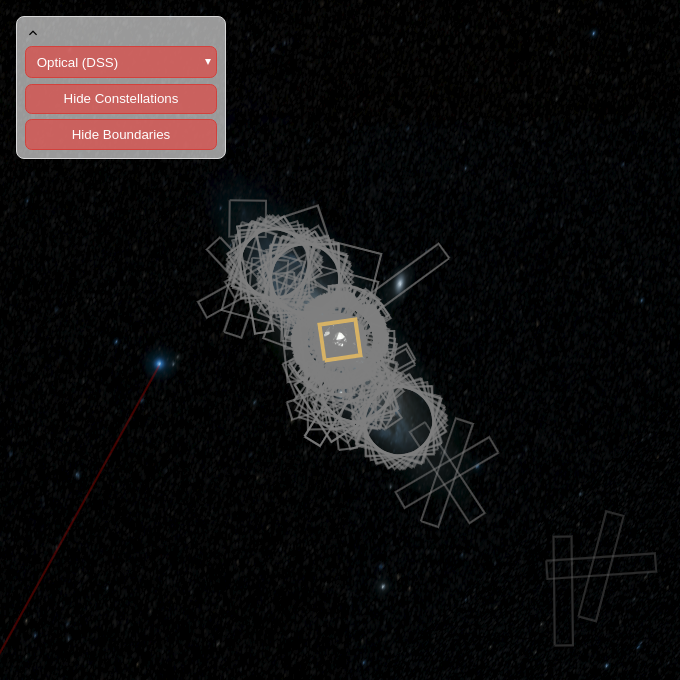
This shows an optical image of the sky - like the DSS version above but much deeper - with an approximate overlay of the instrument shown as an outline. Please note that this outline does not exactly match that shown in the DSS/RASS/PSPC views: it does not account for the exact positioning of the instrument in the focal plane of the telescope and - for ACIS - only shows either the ACIS-S or ACIS-I array. The color used for the outline indicates whether the observation has been recorded as being observed (that is, the Chandra Data Archive has received and processed the data for the observaiton) or not, and uses the same color scheme as the schedule view and sky plots.
For areas that have been observed multiple times by Chandra - as is the case for both M22 and M31 - the outline of other observations are also shown, as gray rectangles. The spirograph-like patterns seen in the M31 case indicate many similar observations but with different "roll angles" (it's like taking pictures with your phone pointed at the same object - probably a cat - while rotating the phone, assuming you have very flexible arms).
The red lines at the bottom of the image show the nearest constellation; not shown in these images are the yellow lines indicating the boundaries of the constellations. If you pan out far enough you can see the "coordinate grid" used to locate objects in the sky: the horizontal axis is "Right Ascension", corresponding to longitude, and is measured from right to, and the vertical axis is "Declination", corresponding to latitude.
In the top-left is a control area which lets you select the background image - across a range of wavelengths - and control over the display: whether to show the constellations, their boundaries, or the outlines of nearby observations. These controls can be minimised or dragged around the WWT display, in case they obscure an area of interest.
The credits for the images used by the WWT can be found on the About page.